
Wild Fork Foods
Driving Conversion and Personalization Through Data-Driven UX
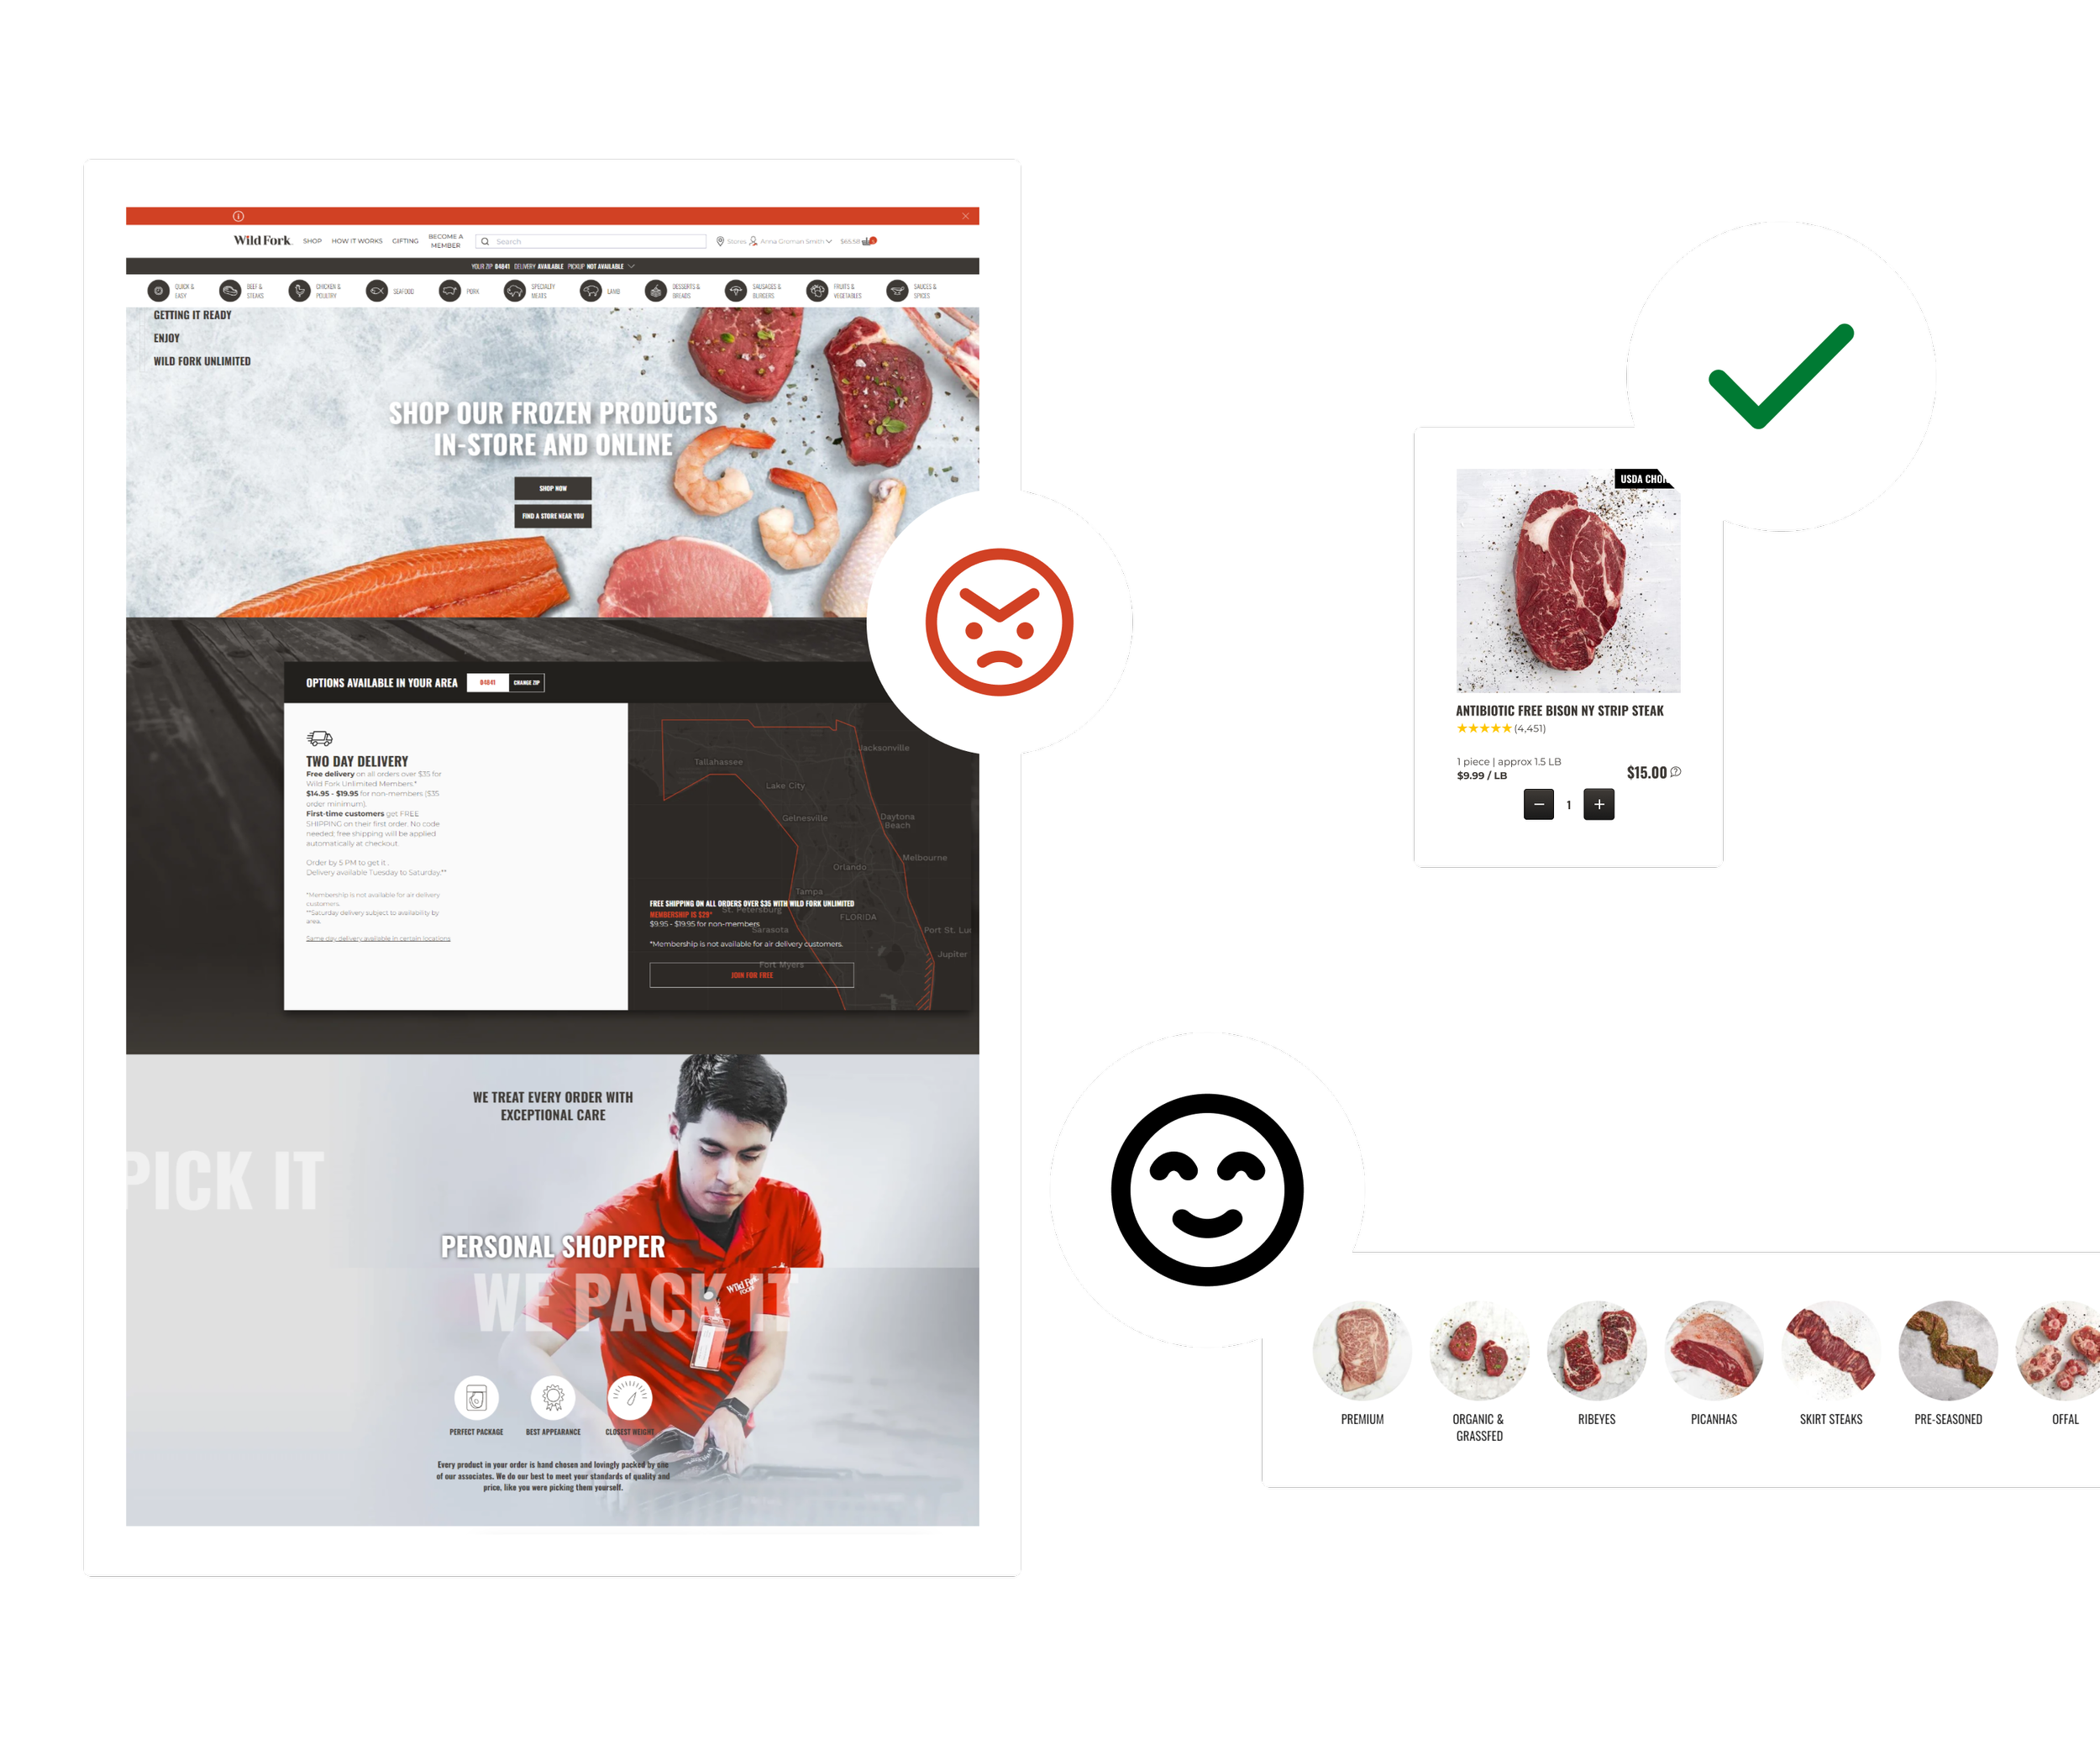
Wild Fork Foods sought to enhance their online shopping experience with a focus on increasing conversions and delivering a personalized user journey. Catering to food enthusiasts and home cooks aged 25–55, the platform emphasized high-quality meat and seafood products at good prices. Leveraging tools like Dynamic Yield and Qualtrics, I designed and executed a series of A/B tests, usability studies, and surveys. These initiatives uncovered user pain points, improved site functionality, and drove measurable outcomes.
The personalization efforts were recognized with the 2023 Personalization Innovator Award, underscoring the impact of these initiatives.
Target User
Food enthusiasts and home cooks aged 25-55
My Role
UX Lead responsible for strategy, execution, and analysis.
Tools
A/B Testing & Personalization: Dynamic Yield
Survey Feedback: Qualtrics
Design & Prototyping: Figma
Collaboration: Microsoft Teams, Jira
Strategy & Approach
To achieve Wild Fork Foods’ goals, I employed a multi-faceted UX strategy:
Conducted usability testing to benchmark the site’s performance and identify initial pain points.
Designed and executed A/B tests targeting specific areas of the site, including product listing pages (PLPs), product detail pages (PDPs), homepage layouts, and cart functionality.
Utilized Dynamic Yield for testing and personalization and Qualtrics to integrate survey feedback, validating hypotheses and gathering deeper user insights.
Worked collaboratively with cross-functional teams, including marketing and development, to implement and monitor changes effectively.
Delivered user-centered solutions using Figma for prototyping and wireframes.
Key Initiatives
-
Usability Testing
Goal: Identify site-wide usability challenges and prioritize opportunities for improvement.
Details: Conducted usability tests across key areas of the site, gathering data on navigation, clarity, and user engagement.
Outcome: Generated actionable insights that informed the direction of subsequent A/B tests, layout optimizations, and feature development.
-

Cart & Checkout Redesign
Goal: Streamline the checkout process and align the cart design with user expectations.
Details: Redesigned the cart and checkout flows based on user testing feedback and best practices for e-commerce UX.
Outcome: The updated cart design has been launched, improving usability, with the checkout redesign poised for release.
Cart redesign resulted in a 21.45% decrease in cart abandonments. -

Personalized Homepage Redesign for New vs. Returning Users
Goal: Tailor homepage content to user segments by showing marketing content to new users and product-focused content to returning users.
Details: A/B tested multiple homepage variations to find the most effective designs for each audience.
Outcome: Enhanced user engagement and reduced bounce rates by 10%, particularly among returning customers.
-

Reviews Placement on PDPs
Goal: Test the impact of moving product reviews above recommendations for specialty items targeting low-intent users.
Details: Adjusted the hierarchy of PDP elements to highlight reviews more prominently.
Outcome: Achieved a 15% increase in conversions for specialty products, leading to expanded implementation across other product lines.
-

Product Option Selector + Survey
Goal: Improve the PDP experience by making meat grade selection easier and gathering user feedback via a Qualtrics survey.
Details: Introduced product option selector buttons and paired the A/B test with an in-page survey to capture user sentiment.
Outcome: Increased selection accuracy and collected qualitative feedback that highlighted improved clarity and convenience.
-

Gifting Enhancements
Goal: Improve the visibility and messaging of gifting options on PLPs, PDPs, and at checkout.
Details: Updated iconography and added clear, user-friendly messages explaining gifting options, supported by A/B testing.
Outcome: Increased user awareness of gifting features, with higher adoption rates during the holiday season.
For those who saw this experience during the holiday season we saw:
+54% gift orders.
+26% revenue/session.
+4.8% aggregate uplift to revenue.
+15% purchases.
+9.5% average order value.
+363k inc. revenue in 2 months.